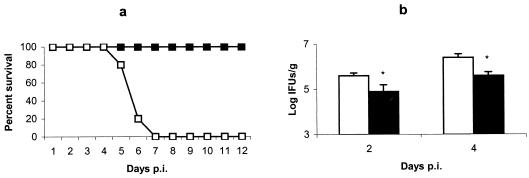
FIG. 1.
Evolution of C. abortus infection in μMT and WT mice. (a) Survival of μMT (□) and WT (▪) mice after infection. Groups of eight mice were infected with 106 IFUs of C. abortus. Mice were monitored daily, and mortality rates were calculated. The experiment was repeated twice, and the data shown are the results for two groups of mice of each strain (16 mice per strain). (b) Quantitative isolation of C. abortus on homogenized tissues from livers of μMT (white columns) and WT (black columns) mice collected at days 2 and 4 p.i. The number of inclusions was visualized by indirect immunofluorescence. The results are the means and SD for five mice per strain infected with 106 IFUs of C. abortus. Experiments were performed two more times with similar results. Asterisks indicate significant differences (P < 0.01) between μMT and WT mice at the same day p.i.

