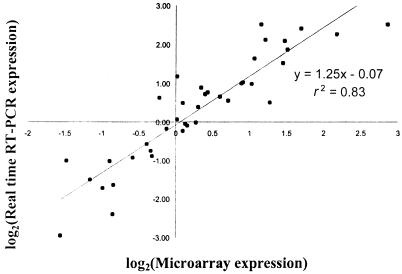
FIG. 1.
Correlation between microarray and real-time RT-PCR expression values. Log2-transformed expression values for 13 genes from bacteria isolated from each of the three infected chickens (c1, c2, and c3) were compared. The best-fit linear regression line is shown together with the r2 value and the calculated equation.

