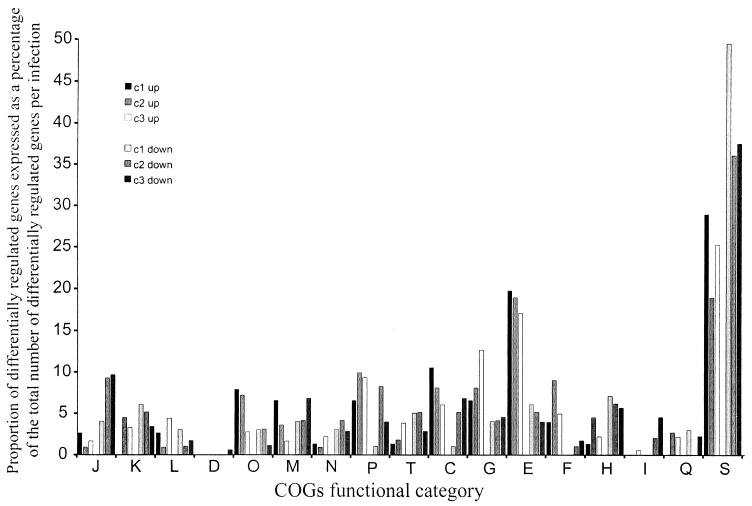
FIG. 4.
The proportion of differentially regulated genes in each COGs category expressed as a percentage of the total number of differentially expressed genes for each infection. The percentages of genes from each infection that were up-regulated (c1 up, c2 up, and c3 up) or down-regulated (c1 down, c2 down, and c3 down) are shown for each COGs category. The COGs functional categories are as described for Fig. 3.

