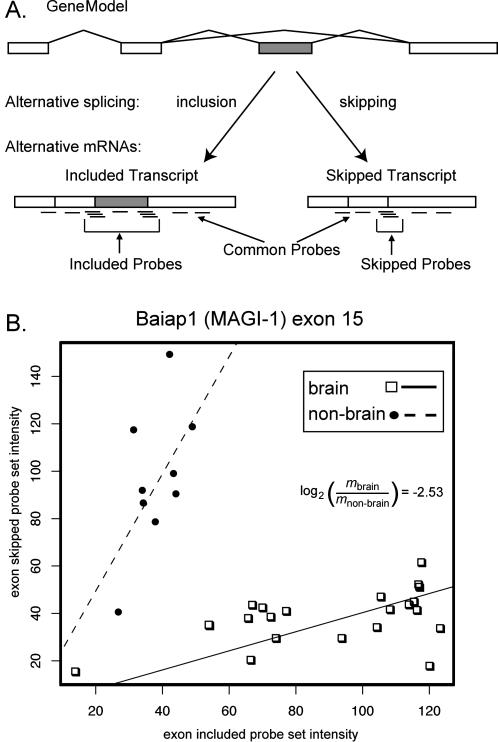
Figure 1. Array Design and Analysis of Splicing-Sensitive Microarray Data.
(A) Probe design and expression counts of alternative event-specific probe sets. Probe sets were designed to both the skipping splice junctions and include splice junctions, as well as the alternative exons when possible, ensuring that probe sets are specific to the exon skipped or included spliced isoforms. Probe sets for constitutive portions of the gene were used to measure overall expression of the locus.
(B) Scatterplot of skip probe set intensity versus include probe set intensity for Biaip exon 15 in brain (squares) and nonbrain (circles) tissue samples. Each data point is derived from one RNA sample and represents the skip-to-include ratio for that sample. The lines represent the robust regression coefficient (constrained to go through the origin) for each tissue group. The log2 difference in the slopes is −2.53, indicating 5.7-fold inclusion in brain relative to nonbrain tissues.

