Figure 1.
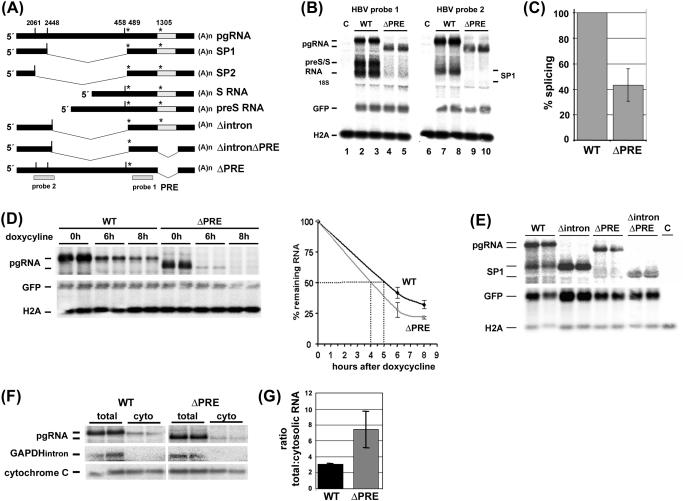
The PRE is required for HBV pgRNA splicing. (A) Schematic drawing of pgRNA, the major spliced RNAs (SP1 and SP2), the subgenomic preS/S RNAs and the pgRNA mutants Δintron, ΔintronΔPRE and ΔPRE. The HBV probes to detect pgRNA and subgenomic RNAs (probe 1), pgRNA and SP1 RNA species (probe 2) are depicted. Grey box = PRE; vertical dash, 5′ splice donor; *, 3′ splice acceptor. (B) Deletion of the PRE reduces the levels of the major splice product SP1 and of preS/S mRNA. HuH-7 cells were cotransfected with each 1.5 µg of plasmid tetHBV-Wild-type (WT) or tetHBV-ΔPRE (ΔPRE, deletion of nt 1254–1582), 0.5 µg of the transactivator expressing plasmid pUHD-TA and 0.07 µg pEGFP-N1 to monitor transfection efficiency. Forty-eight hours thereafter RNA was prepared and 10 µg total RNA was analyzed by northern blotting. The pgRNA and the subgenomic HBV RNAs (preS and S RNA) were detected using HBV probe 1. A second aliquot of RNA from the same preparation was loaded on to a second gel and analyzed by northern blotting using HBV probe 2 detecting pgRNA and the major spliced RNA (SP1). To normalize RNA loading and transfection efficiency the same blots were hybridized with histone H2A (H2A) and GFP mRNA (GFP) specific probes. M, total RNA prepared from untransfected cells. (C) Deletion of the PRE reduces splicing. Six independent experiments performed in duplicates were quantified by phosphoimaging and HBV RNA levels were normalized against RNA loading and transfection efficiency. The percentage of splicing reflects the ratio between the signal intensity of the SP1 RNA and the pgRNA. The HBV wild-type SP1: pgRNA ratio was set as 100%. The SD is indicated (± SD; n = 6). (D) The PRE contributes to pgRNA stability. HuH7 cells were cotransfected with each 1.5 µg of plasmid tetHBV-WT (WT) or tetHBV-ΔPRE (ΔPRE), 0.5 µg of the transactivator expressing plasmid pUHD-TA and 0.07 µg pEGFP-N1 to monitor transfection efficiency. Forty-hours thereafter, cells were harvested (time point 0 h) or doxycycline was added and cells were harvested at 6 or 8 h thereafter. RNA was prepared and 10 µg total RNA was analyzed by northern blotting using HBV probe 2 to detected pgRNA. To normalize RNA loading and transfection efficiency the same blots were hybridized with a histone H2A (H2A) and a GFP mRNA (GFP) specific probe. Two independent experiments performed in duplicates were analyzed, quantified by phosphorimaging and HBV RNA levels were normalized against RNA loading and transfection efficiency. The SDs are indicated (±; n = 2). (E) ΔintronΔPRE pgRNA is stably expressed. HuH7 cells were cotransfected with each 1.5 µg of plasmid tetHBV-WT (WT), tetHBV-Δintron (Δintron, deletion of nt 2446–2496), tetHBV-ΔPRE (ΔPRE; deletion of nt 1254–1582), tetHBV-ΔintronΔPRE (ΔintronΔPRE, deletion of nt 2446–2496 and of nt 1254–1582), 0.5 µg of the transactivator expressing plasmid pUHD-TA and 0.07 µg pEGFP-N1 to monitor transfection efficiency. Forty-eight hours thereafter RNA was prepared and 10 µg total RNA was analyzed by northern blotting using HBV probe 2 to detected pgRNA, GFP and H2A probes to confirm transfection efficiency and RNA loading, respectively. C, mock transfection. (F) Cytosolic accumulation of pgRNA does not depend on the PRE. HuH7 cells were cotransfected in duplicates with each 1.5 µg of plasmid tetHBV-WT (WT) or tetHBV-ΔPRE (ΔPRE), 0.5 µg of the transactivator expressing plasmid pUHD-TA and 0.07 µg pEGFP-N1 to monitor transfection efficiency. Forty hours thereafter, cells were harvested and total RNA (total) and cytosolic RNA (cyto) was prepared as described in Materials and Methods. RNAs were analyzed by northern blotting using HBV probe 2 to detected HBV pgRNAs. Contamination of the cytosolic RNA fraction with pre-mRNAs was monitored by reprobing the membrane with a probe directed against a GAPDH intron (GAPDHintron) and the quality of the cytosolic RNA preparation was monitored by detection of the cytochrome c Oxidase II mRNA. RNAs of two independent transfections were loaded and analyzed. One representative northern blot is shown. For quantification, the northern blot membranes were reprobed with a Histone H2A probe (data not shown) and used for normalization of RNA loading. Each transfection was quantified independently, the mean was calculated and the SD is indicated (±, n = 2). (G) Ratio between total and cytosolic WT and ΔPRE pgRNA was calculated and blotted.

