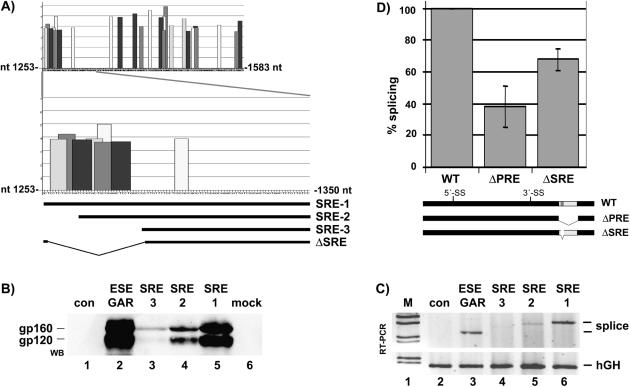
Figure 2.
The PRE contains a splicing enhancer referred to as SRE-1. (A) Prediction of a cluster of SR protein-binding sites at the 5′ end of the PRE. The ESEfinder program (44) predicts potential binding sites for SF2/ASF, SC35, SRp55 and SRp40. The PRE sequence (nt 1253–1583) was analyzed by the ESEfinder and to increase stringency the threshold was set to 3 for all predicted binding sites. The 5′ end of the PRE (nt 1253–1350) containing a cluster of potential SR protein-binding sites is enlarged. SRE-1, SRE-2 and SRE-3 depicts the sequence cloned into the HIV glycoprotein reporter plasmid and analyzed for enhancer activity. ΔSRE illustrate a deletion (nt 1254–1289) introduced into the HBV expression plasmid pHBV-ΔSRE used in Figure 2D. (B–D) The 5′ end of the PRE contains a splicing enhancer. (B) The PRE sequences SRE-1, SRE-2 and SRE-3 were cloned into the HIV glycoprotein reporter plasmid SV-env. HeLa-T4+ cells were co-transfected with different HIV glycoprotein reporter plasmids containing no enhancer (con), the HIV GAR ESE (36) or the SRE-1, SRE-2 or SRE-3 sequences. The HIV Rev protein was co-expressed. Protein extracts were prepared 48 h later and analyzed by western blotting (WB) as described in Materials and Methods. As shown in (B) the SRE-1 element and the GAR ESE increase strongly gp160 and gp120 expression, whereas SRE-2 and SRE-3 were less efficient. (C) HeLa-T4+ cells were cotransfected with different HIV glycoprotein reporter plasmids containing no enhancer (con), the HIV GAR ESE (36) or the SRE-1, SRE-2 or SRE-3 sequences. The HIV Rev protein was not co-expressed. Total RNA was prepared 30 h later and analyzed by RT–PCR as described in Materials and Methods. SRE-1 and the GAR-ESE strongly stimulate splicing (splice) whereas SRE-2 and SRE-3 were less efficient. The human growth hormone gene (hGH) was used as a loading control. M, molecular weight marker. (D) HuH-7 cells were cotransfected with each 1.5 µg of plasmid tetHBV-WT (WT), tetHBV-ΔPRE (ΔPRE), tetHBV-ΔSRE (ΔSRE; nt 1254–1289) and analyzed as described in Figure 1B and Materials and Methods. Three independent experiments performed in duplicates were quantified by phosphoimaging and HBV RNA levels were normalized against RNA loading and transfection efficiency. The percentage of splicing reflects the ratio between the signal intensity of the SP1 RNA and the pgRNA. The HBV wild-type SP1: pgRNA ratio was set as 100%. The SD is indicated (±; n = 3–6). SRE, splicing regulatory element; ESE, exonic splicing enhancer; 5′ss/3′ss, splice donor/splice acceptor site.

