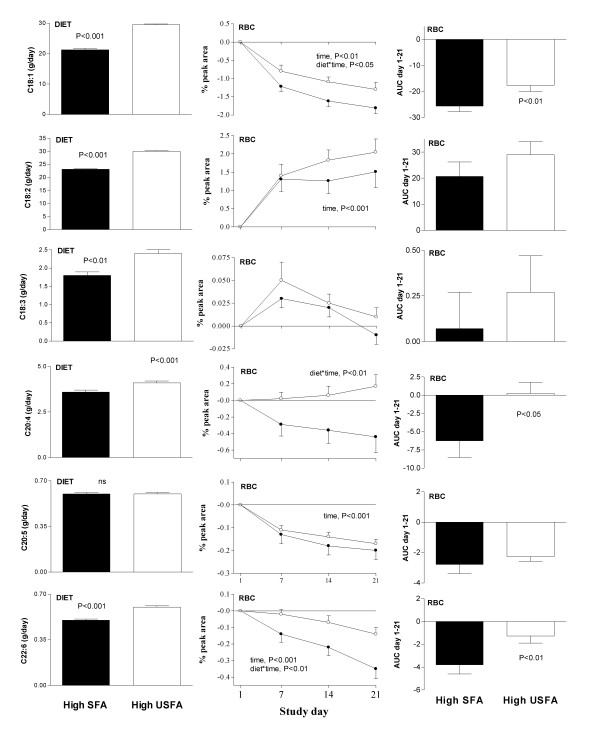
Figure 2.
Dietary (left panel) and red blood cell (RBC, centre and right panels) mono- and polyunsaturated fatty acid composition during the 3 week high-saturated (high-SFA) and high-unsaturated (high-USFA) dietary treatments. Diet was strictly controlled by providing subjects with all food and drinks throughout the 6 week residential intervention. Treatments were separated by a minimum 4 week wash-out period. Change in RBC membrane fatty acids was measured on day 1, d7, d14 and d21 of each intervention arm (● high-SFA, ○ high-USFA). AUC day 1–21, area under the curve of change in RBC % peak area.

