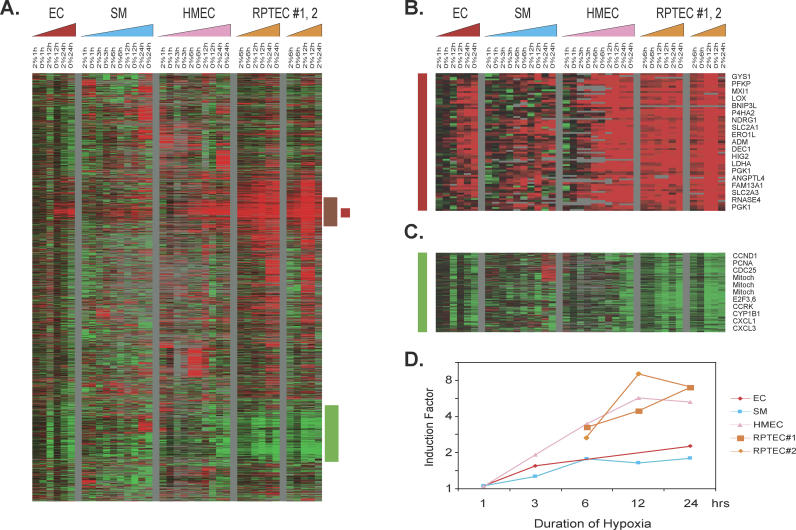
Figure 1. Overview of the Genomic Responses to Hypoxia.
(A–C) Hierarchical clustering of a total of 4,333 elements that display a greater than 3-fold change in mRNA expression in more than four different samples when exposed to hypoxia (A). Data from individual elements or genes are represented as single rows, and different time points in the time courses (triangles) are shown as columns. Red and green denote expression levels of samples cultured under hypoxia (2% O2) or anoxia (0% O2) greater or lower, respectively, than baseline values of samples cultured under ambient air (∼21% O2). The intensity of the color reflects the magnitude of the change from baseline. The color of the triangles represents the time course of the different cell types (red, ECs; blue, SMCs; pink, HMECs; orange, RPTECs). The vertical red bar marks a cluster of genes induced in all cells, termed the “common hypoxia genes” (B); the vertical brown bar marks a cluster of genes induced in all epithelial cells, termed the “epithelial hypoxia genes”; and the vertical green bar marks a cluster of genes repressed in all cells, termed the “commonly repressed hypoxia genes” (C). The gene clusters representing “common hypoxia genes” (B) and the “commonly repressed hypoxia genes” (C) are expanded to show the names of representative genes on the right side.
(D) Average folds of gene induction (y-axis) in the common hypoxia genes cluster from each indicated cell type at different time points (x-axis) are calculated and shown. (Complete data can be found at: http://microarray-pubs.stanford.edu/hypoxia)

