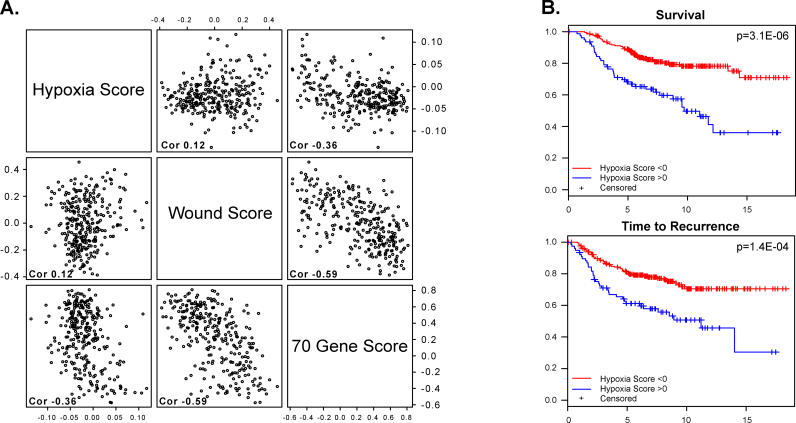
Figure 5. Quantitative Analyses of the Prognostic Significance of the Hypoxia Response Signature.
Response signature was analyzed in the 295 breast cancer samples in the NKI study
(A) Scatter plots showing the relationship between the value of the average expression level of the genes in the hypoxia signature and that of genes in the wound response signature [22] or 70-gene signature [48]. Each point in the scatter plots represents a single one of the 295 tumors analyzed in the NKI dataset. The overall correlation between each pair of expression signatures across this set of 295 samples is indicated in each panel.
(B) With the threshold value of the hypoxia response signature for classification of patients into high and low hypoxia response groups set at zero, the Kaplan-Meier curve shows significant differences in survival and time to recurrence between the samples in the high and low hypoxia response groups of these breast cancer samples.

