Figure 2.

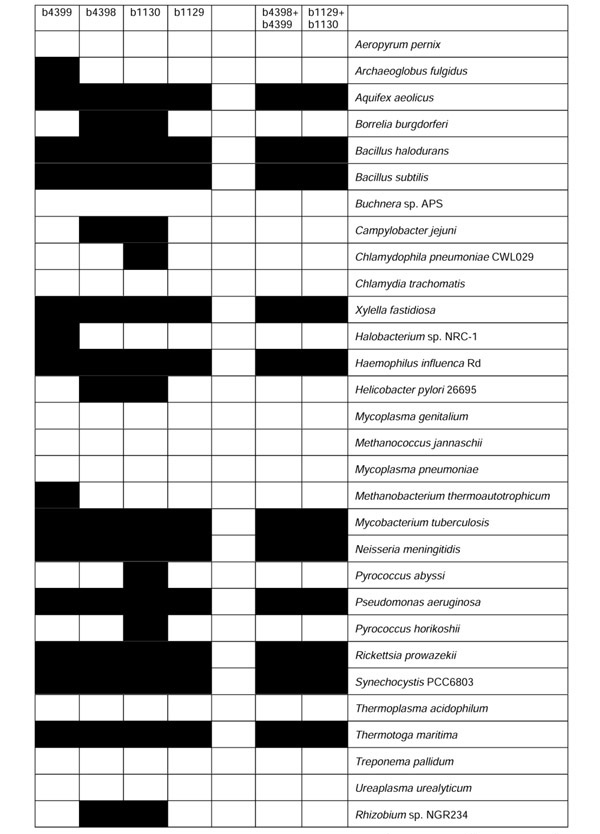
Comparison of gene cluster profile and single-gene profile. Filled cells (black) represent the presence of a gene or a gene pair in the genome and empty cells represent its absence.

Comparison of gene cluster profile and single-gene profile. Filled cells (black) represent the presence of a gene or a gene pair in the genome and empty cells represent its absence.