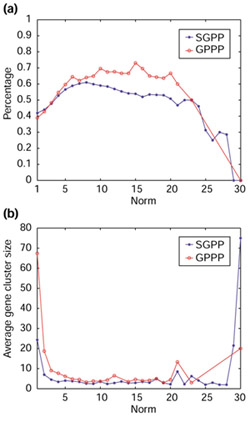
Figure 3.

Comparison of the accuracy of GPPP and SGPP. (a) Comparison of the accuracy of GPPP and SGPP using the proportion of 'pure' clusters. The x-axis represents the norm of the profiles and the y-axis the percentage of 'pure' clusters among all clusters. (b) Average cluster size of GPPP and SGPP. In this and the following figures, the data points from GPPP are marked by circles and those from SGPP are marked by stars.
