
Figure 3.
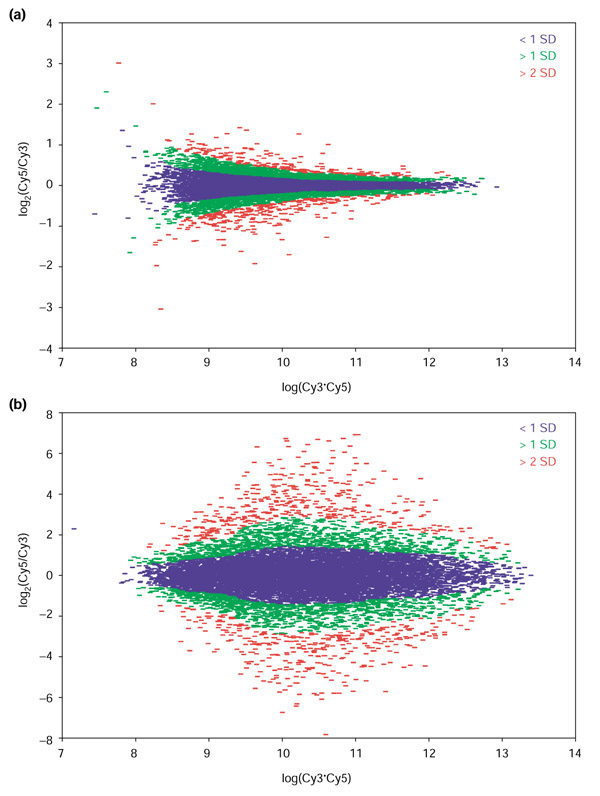
Intensity-dependent calculations of SDs described in the text show distinct patterns that depend on how closely related are the samples being compared. (a) The 'tadpole' pattern seen in the self-self hybridization of RNA samples from the KM12L4A cell line is characteristic of RNA samples derived from similar sources are compared. (b) RNA samples from very different samples show a characteristic 'eye' pattern, with greater diversity of expression for genes expressed at intermediate levels, as seen in this co-hybridization of a Cy5-labeled PA-1 (ovary) with a Cy3-labeled CaCO2 (colon) RNA sample.