
Figure 4.
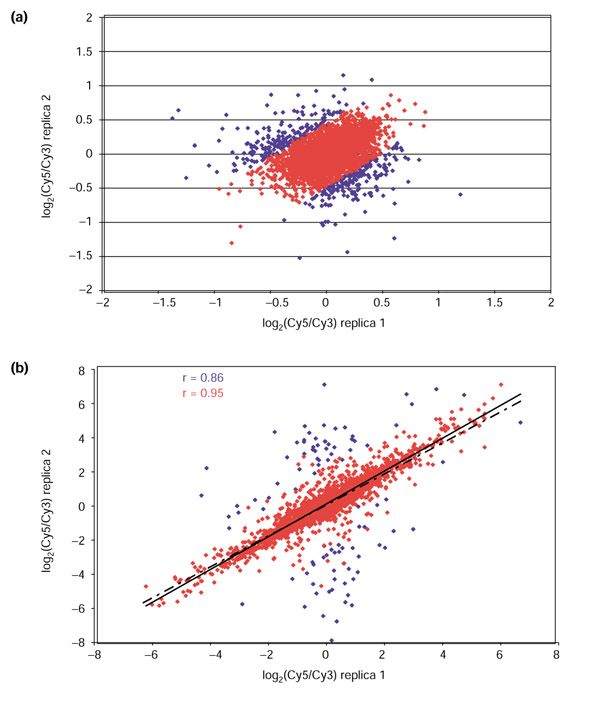
Replicate filtering within an array can reduce variability in the data. Scatterplots showing correlation coefficients (r) for the logarithms of the Cy5/Cy3 ratios for duplicate spots within arrays for (a) a self-self hybridization of RNA samples from the CaOV3 cell line and (b) a co-hybridization of a Cy5-labeled PA-1 with a Cy3-labeled CaCO2 RNA sample. In both cases, data before replicate filtering (blue) includes a number of outliers that are eliminated from the filtered data (red), resulting in a much better correlation between duplicate measurements