Figure 4.

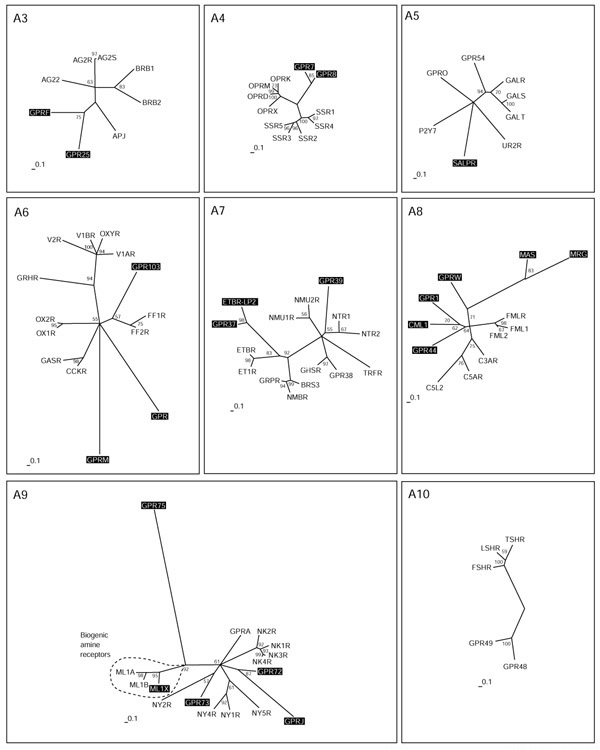
Peptide receptors (subgroups A3-A10). The scale bar indicates a maximum likelihood branch length of 0.1 inferred substitutions per site. Orphan receptors are shaded. For method see Figure 2

Peptide receptors (subgroups A3-A10). The scale bar indicates a maximum likelihood branch length of 0.1 inferred substitutions per site. Orphan receptors are shaded. For method see Figure 2