
Figure 2.
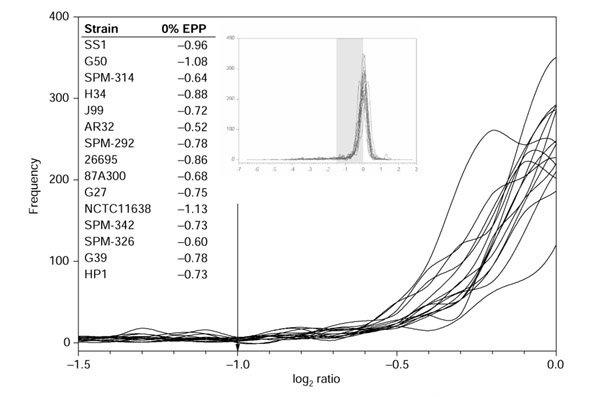
Magnified image of the ratio distributions of all previously published H. pylori strains. The arrow indicates the published constant cutoff. Inset chart: the full ratio distributions of H. pylori. The shaded region indicates the magnified region. Inset table: the log ratio values of the 0% EPP transition points chosen by GACK in a strict analysis of divergent genes.