
Figure 4.
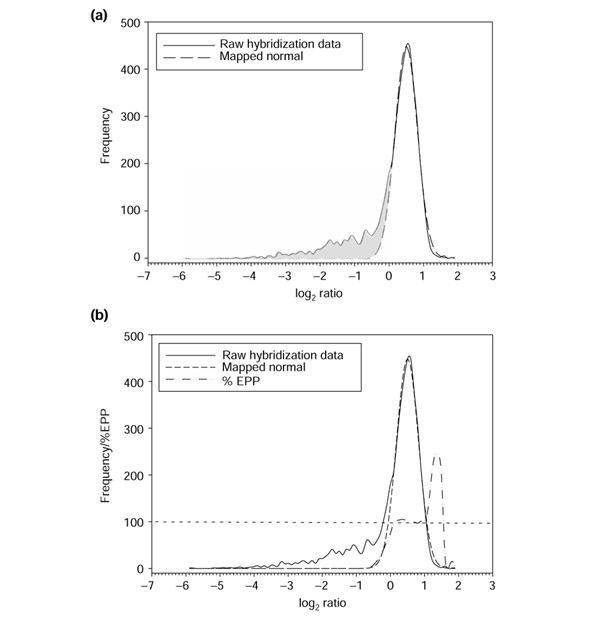
Distribution for S. bongori. (a) Distribution of log ratios for an S. bongori hybridization with a serovar Typhimurium reference. The mapped normal curve estimates the general shape of the main peak; the difference between this idealized curve and the observed data is indicated by the shaded region. (b) The EPP distribution is negligible in the left tail, but increases quickly to 100% as the estimated proportion of present genes increases in the transition region.