
Figure 9.
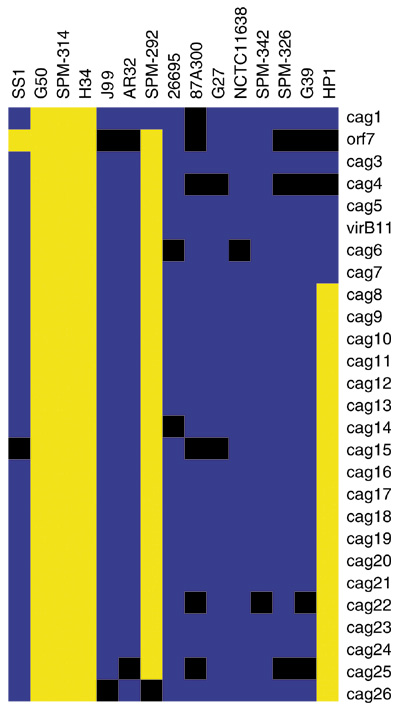
The cag pathogenicity island of H. pylori. Trinary GACK output was directly visualized in Treeview [22]. Blue denotes present genes, black slightly divergent genes, and yellow highly divergent genes.
Official websites use .gov
A
.gov website belongs to an official
government organization in the United States.
Secure .gov websites use HTTPS
A lock (
) or https:// means you've safely
connected to the .gov website. Share sensitive
information only on official, secure websites.
The cag pathogenicity island of H. pylori. Trinary GACK output was directly visualized in Treeview [22]. Blue denotes present genes, black slightly divergent genes, and yellow highly divergent genes.