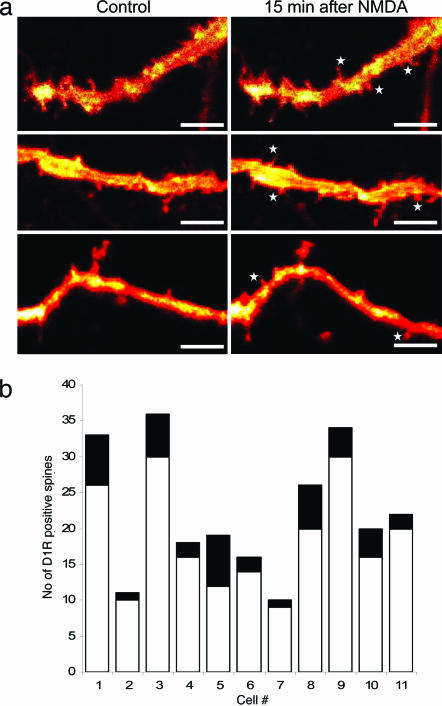
Fig. 2.
Number of D1R positive spines before and after NMDA exposer. (a) Magnification of a segment of a dendritic tree expressing D1R-Venus. Asterisks indicate new D1R-positive spines after NMDA treatment. (Scale bar: 10 μm.) (b) Spines were counted 10–15 min after terminating exposure to NMDA (10–3 M for 30 s). D1R-positive spines under control conditions are indicated by the open parts of the bars; additional D1R-positive spines after NMDA exposure are indicated by the filled parts of the bars.

