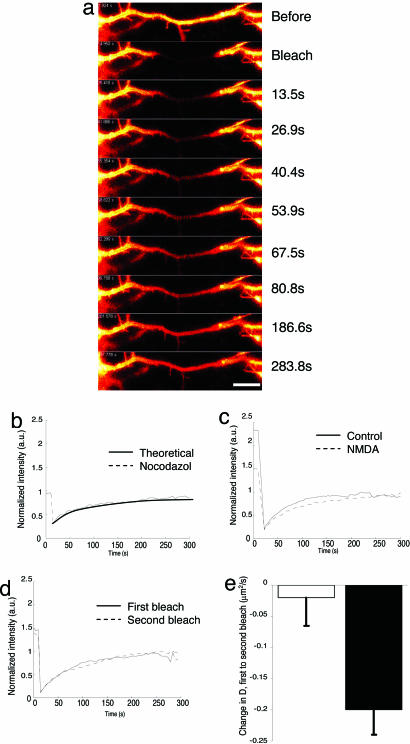
Fig. 3.
Lateral diffusion of D1R studied with FRAP. (a) Representative time series from a FRAP experiment. (Scale bar: 10 μm.) (b) Fluorescence recovery after disruption of microtubules by nocodazole (10–4 M, 20-min treatment before recording). (c) Treatment with NMDA (dashed line, 10–3 M) reduces fluorescence recovery rate. Similar results were found for 10–5 M, 10–4 M, and 10–3 M NMDA. (d) Fluorescence recovery rate after repeated bleaching sessions. solid line, first bleach; dashed line, second bleach. (e) Change in diffusion coefficient between first and second bleach (open bar) before and after exposure to NMDA, 10–3 M (filled bar), n = 5.

