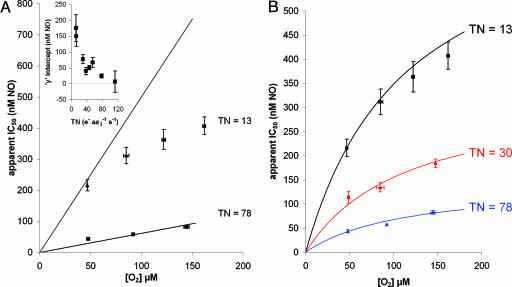
Fig. 2.
Apparent IC50 for NO as a function of [O2] at different enzyme TN. (A) Data points represent experimental data: ▴, TN = 13; ▪, TN = 78 (e– s–1 aa3–1). Error bars represent SEM. Solid lines represent best fit obtained according to the theoretical model proposed by Antunes et al. (43). The optimal rate constants for the fit were obtained by linear regression at the higher TN value. The values of the rate constants obtained were then used to attempt to predict the data at the lower turnover. (Inset) The apparent IC50 for NO as a function of TN at zero oxygen (i.e., y-axis from linear regression with no theoretical constraints). Error bars represent SEM. (B) Here the data are fitted to an expanded model (Fig. 3) in which NO can interact both competitively and noncompetitively with oxygen when the binuclear center is in either the reduced (ferrous a3) or oxidized (cupric CuB) state.

