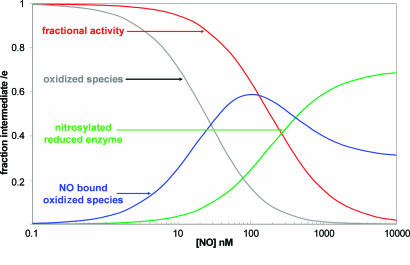
Fig. 5.
Predicted populations of oxidase intermediates and computed turnover as a function of [NO]. The model shown in Fig. 3 was used to generate the predicted populations of oxidized enzyme, NO complexes of oxidized enzyme, and the final NO–ferrous complex. The values shown were obtained for an observed turnover of 15 sec–1, at 49 μMO2, using the parameters: ko = 400 μM; kr = 15.7 sec–1; ke = 325 sec–1; KD = 0.2 nM; and K′D = 28 nM. Population of these species at 49, 88, and 150 μM O2 can be seen in Fig. 7, which is published as supporting information on the PNAS web site.

