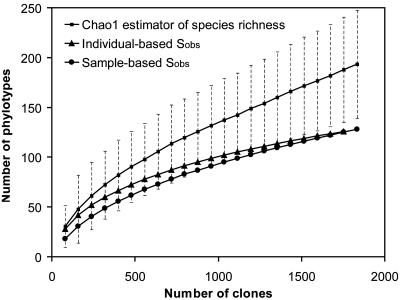
Fig. 2.
Rarefaction analysis of the overall, combined bacterial 16S rRNA gene clone library recovered from human gastric biopsy specimens. The rarefaction curve, plotting the number of observed phylotypes (Sobs) as a function of the number of clones, was computed by estimates. The corrected Chao1 estimator for species richness (after 1,000 randomizations) was plotted as well. The dotted lines indicate the 95% confidence interval.

