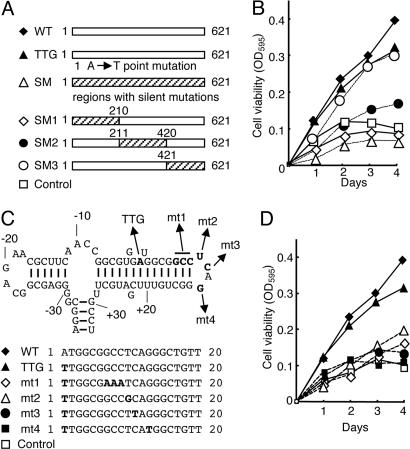
Fig. 4.
Functional analyses of mutated HBZ genes on proliferation of T cells. (A) Schemas of mutant HBZ genes. (B) The effects of mutated HBZ genes on cell growth were measured by assays. The hatched area represents the region containing silent mutations. Numbers indicate the nucleotide positions in the HBZ coding sequence. (C) Predicted stem-loop structure in HBZ mRNA of the native HBZ gene (from –35 to +33). Nucleotides are numbered from the first ATG (A: +1) of the HBZ gene. Structural predictions were analyzed by using mfold (24). Mutated sequences of each vector are shown in bold type. (D) The results of 3-(4,5-dimethylthiazol-2-yl)-2,5-diphenyl tetrazolium bromide assays with these vectors are shown.

