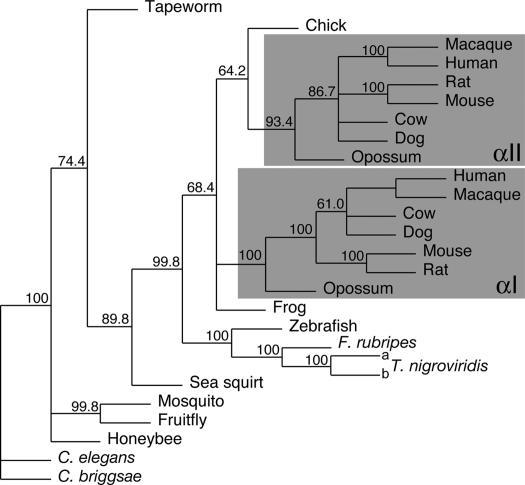
Fig. 3.
Maximum likelihood phylogenetic tree of α-spectrins. cDNA sequences encoding the region from the N-terminal helix through the second full repeat were aligned and analyzed by maximum likelihood with the aid of phyml. Five hundred bootstrapped replicates were examined, and a consensus tree was built from these by using phylip consense. Numbers shown at forks indicate the percentage occurrence among the trees of the group consisting of the species to the right of that fork. The groups of organisms containing both αI- and αII-spectrin are shaded. The organisms and cDNA sequences used are as listed in Table 1.

