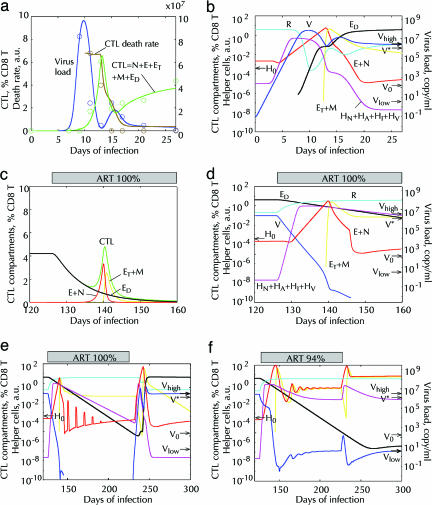
Fig. 6.
Fitting of three experiments consecutive in time, acute infection (10), onset of ART (25), long-term and interrupted ART (28), based on the model (Fig. 5, without the dashed arrow). (a and b) Acute infection with 20 infectious doses (0.2 RNA copy per ml) of virus. (a) Circle, data for animal p88 infected with SIVmac251 (10). Solid lines, best-fit predicted dependencies. (b) Predicted cell numbers in six important cell compartments (on the curves). The values of V and R are shown in virus units on the right y-axis. Arrows show the values of Vlow, Vhigh, and V* (Fig. 2 and legend) and H0.(c and d) First weeks of 100% efficacious ART (p = pR = 0) simulating experiment in ref. 25. Predicted cell compartments are shown in linear (c) and logarithmic (d) scale. (e and f) Simulated kinetics of interrupted ART similar to experiment in ref. 28. Drug efficacy: 100% (e) and 94% (f): p(126 < t < 236) = 0.06p(t < 126). One-day pulses of 5 i.d. of virus (V) each 10th day simulate bursts from latent reservoirs. (a–f) Fitting parameters (Fig. 5): p = 100 per day per virus unit (vu); Ri = 3.8vu; dA = 0.94/day; dI = 1.26/day; HNi = 10–5; Ni = 2.2 × 10⁻³ % CD8 cells; f = 0.14; c = 3.41/day; d = 2.42/day; k = 1.06/day per cell; r = 6.5/day; V0 = 4.3 × 10⁻⁶vu; H0 = 4 × 10⁻⁴; a = 1.4/day per vu; dD = 0.13/day; m = 1.18/day; dH = 0.085/day; pR = 1.98/day per vu; sA = 0.44vu/day. Here, vu = 1 p27 ng/ml = 3 × 10⁷ RNA copies per ml. Fixed parameters: dN = 10–3 per day; mH = 0.1/day; Em = 100%.

