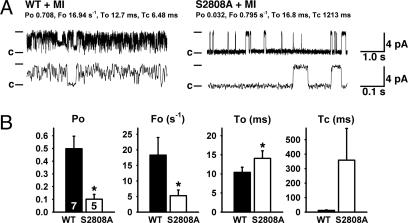
Fig. 5.
Normalized RyR2 channel function in RyR2-S2808A mice after MI. (A) RyR2 channels isolated from hearts 28 days after MI showed reduced Po in RyR2-S2808A mice compared with WT. Representative single-channel tracings are shown at 150 nM Ca2+. Fo, frequency of channel opening (s–1); To, average open time (ms); and Tc, average closed time (ms); values correspond to the representative tracing shown. Duration upper tracings, 5 s; bottom tracings, 0.5 s. Current amplitude of full openings is 4 pA; c, closed state of channel. (B) Bar graphs show mean values for WT (n = 7 channels) and RyR2-S2808A (n = 5 channels). *, P < 0.05.

