
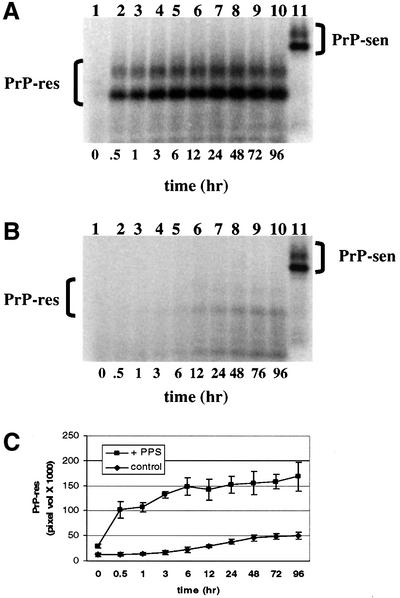
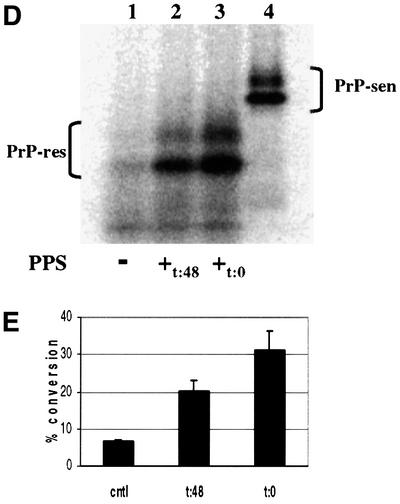
Fig. 6. Kinetics of hamster GPI(–) PrP cell-free conversion. The rate of [35S]PrP-res formation was determined for both PPS-stimulated and non-stimulated control cell-free conversion reactions over 96 h. [35S]PrP-res accumulation was determined for the time intervals indicated. [35S]PrP-sen representing 20% of the input radioactivity is shown in lane 11. (A) Kinetics of PPS-stimulated PrP cell-free conversion. (B) Kinetics of control cell-free conversion (without PPS). (C) Comparison of PPS-stimulated and control conversion reaction kinetics. Error bars show the standard deviation (n = 3). (D) Effect of adding PPS after non-stimulated cell-free conversion. Lane 1, 72 h incubation without PPS (–); lane 2, 48 h non-stimulated incubation followed by 24 h incubation with PPS (+t:48); lane 3, 72 h incubation with PPS (+t:0); lane 4, [35S]PrP-sen representing 20% of the input radioactivity shown in lanes 1, 2 and 3. (E) Percentage conversion of adding PPS after non-stimulated cell-free conversion. cntl = no added PPS; t:48 = PPS added after 48 h of non-stimulated cell-free conversion; t:0 = PPS added initially. Error bars indicate the standard deviation (n = 3).