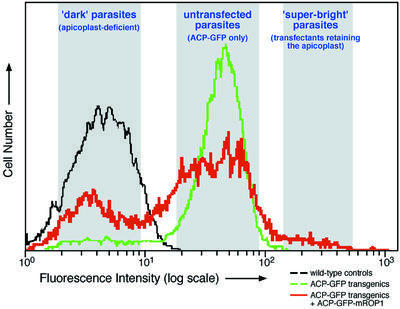
Fig. 5. Apicoplast-free parasites and parasites containing non-segregating apicoplasts can be isolated by FACS. The red line indicates the fluorescence intensity distribution of ACP–GFP transgenic parasites transiently transfected with ACP–GFP–mROP1. Approximately 60% of parasites did not take up and/or express the ACP–GFP–mROP1 plasmid (central shaded area), and exhibit fluorescence comparable to the parental ACP–GFP transgenics (green line). More than 35% of parasites were comparable in intensity to wild-type controls lacking any GFP (black line). This ‘dark’ population (left-most shaded area) consists of parasites that lost their apicoplast (see Figures 1–4 and text). Less than 5% of the population (right-most shaded area) were brighter than any parasites seen in untransfected parasites expressing ACP–GFP (green line). This ‘super-bright’ population consists of parasites that retained the single giant apicoplast during mis-segregation (see Figures 1 and 3). Parasites were isolated from each of the shaded regions for further experiments (see text and Figure 6).
