
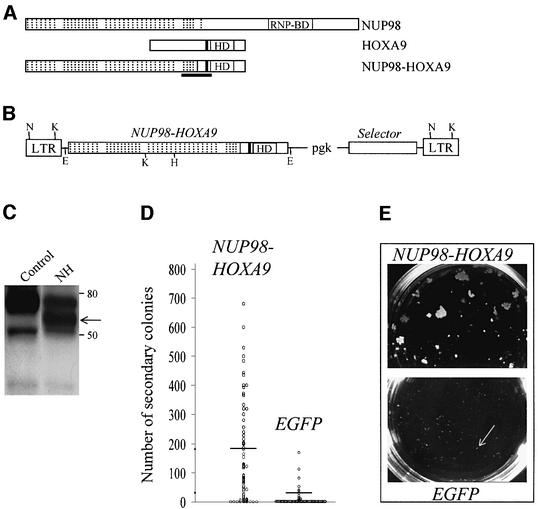
Fig. 1. Recombinant retrovirus-mediated expression of NUP98–HOXA9 in primary bone marrow cells results in enhanced proliferation in vitro. Schematic representations of NUP98, HOXA9 and the NUP98–HOXA9 fusion protein (A) and the MSCV (Hawley et al., 1994) retroviral vector employed in these studies (B), the demonstration that the recombinant retrovirus directs the expression of the appropriate protein in infected cells (C), and that NUP98–HOXA9 expression in bone marrow cells enhances the proliferative potential of myeloid progenitor cells in vitro (D, E). (A) Hashed lines denote the 38 FG repeats of NUP98, 37 of which are retained in the fusion protein NUP98–HOXA9; HD, DNA-binding homeodomain; the tryptophan required for NUP98–HOXA9 and HOXA9 interaction with DNA binding partner PBX (Kasper et al., 1999; Schnabel et al., 2000) is represented by the black line N-terminal to the HD; the region of NUP98–HOXA9 corresponding to a peptide used to raise antibodies against the fusion protein is underlined. (B) The MSCV retroviral vector utilized in these studies directs the expression of the gene of interest from the viral LTR, while the selector gene [conferring antibiotic resistance to G418 (Neo) or puromycin (Pac), or inducing green (EGFP) or yellow (EYFP) fluorescence] is expressed from the internal pgk promoter. Restriction sites are shown for EcoRI (E), HindIII (H), KpnI (K) and NheI (N). (C) Western blot analysis of total cell extracts of NUP98–HOXA9-infected (lane NH) or control Rat-1 fibroblasts, probed with antiserum raised against a NUP98–HOXA9 peptide (see A). The positions of the 59 kDa NUP98–HOXA9 protein (arrow) and of size markers are indicated. For (D) and (E), randomly selected, individual colonies derived from freshly infected (EGFP+, as determined by fluorescence microscopy) bone marrow cells grown in semi-solid methylcellulose cultures were isolated, dispersed and replated in secondary cultures. (D) The number of secondary colonies that arose from each replated primary colony is shown for cells infected with the NUP98–HOXA9 and the control EGFP retroviruses. The replating efficiency, the percentage of primary colonies generating secondary colonies, was 88% for NUP98–HOXA9 (69 of 78 primary colonies analyzed, yielding an average of 181 secondary colonies per dish) and 30% for EGFP (20 of 66 colonies analyzed, yielding an average of 32 secondary colonies). Horizontal lines indicate the average number of secondary colonies. These numbers were generated from two independent bone marrow infection experiments. (E) The size of secondary colonies generated by cells expressing NUP98–HOXA9 is much larger than those derived from the control EGFP-expressing cells (indicated by arrow), as can be seen in these macroscopic views of the 3.5 cm methylcellulose culture dishes. Typical examples are shown.