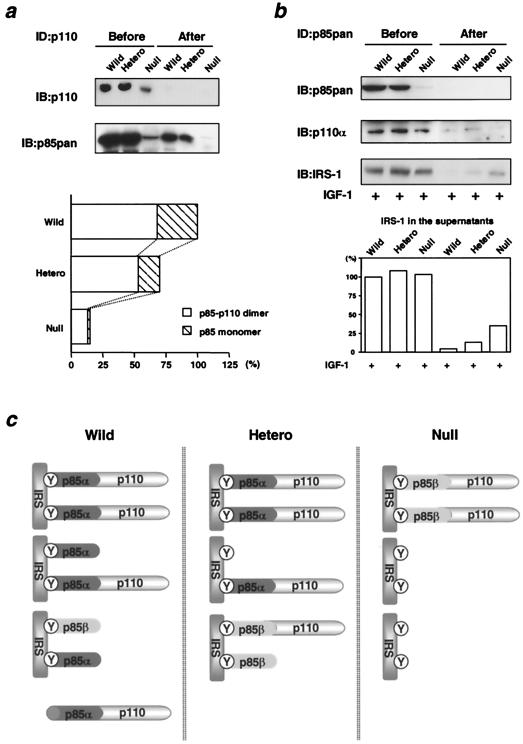
FIG. 4.
Molecular balance among p85 regulatory subunits, p110 catalytic subunits, and phosphorylated IRS proteins. (a) Excess of p85 regulatory subunits in relation to p110 catalytic subunits. Cell lysates were subjected to three rounds of immunodepletion using αp110pan antibody followed by immunoblotting with αp110pan (top panel) or αp85pan (bottom panel) antibody. The amount of the p85-p110 dimer and the p85 monomer was expressed as a ratio to the amount of total p85 in the wild-type cells. In the bottom graph, each bar represents the ratio normalized to the total p85 in wild-type (Wild) cells. (b) Molecular balance between p85 regulatory subunits and phosphorylated IRS proteins. Cell lysates were subjected to three rounds of immunodepletion using αp85pan antibody followed by immunoblotting with αp85pan (top panel), αp110α (middle panel), or 4G10 (bottom panel) antibody. In the bottom graph, each bar represents phosphorylated IRS proteins detected by 4G10 in the lysates before or after immunodepletion, expressed as a ratio to the amount in wild-type cells before immunodepletion. (c) A hypothetical model of the molecular balance between p85 regulatory subunits, p110 catalytic subunits, and phosphorylated IRS proteins in cells of each genotype. Hetero, heterozygous KO; Y, phosphorylated tyrosine; ID, immunodepletion.

