FIG. 3.
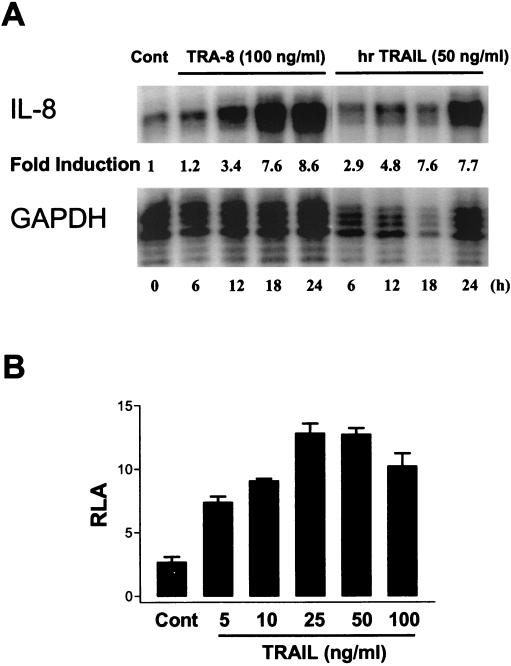
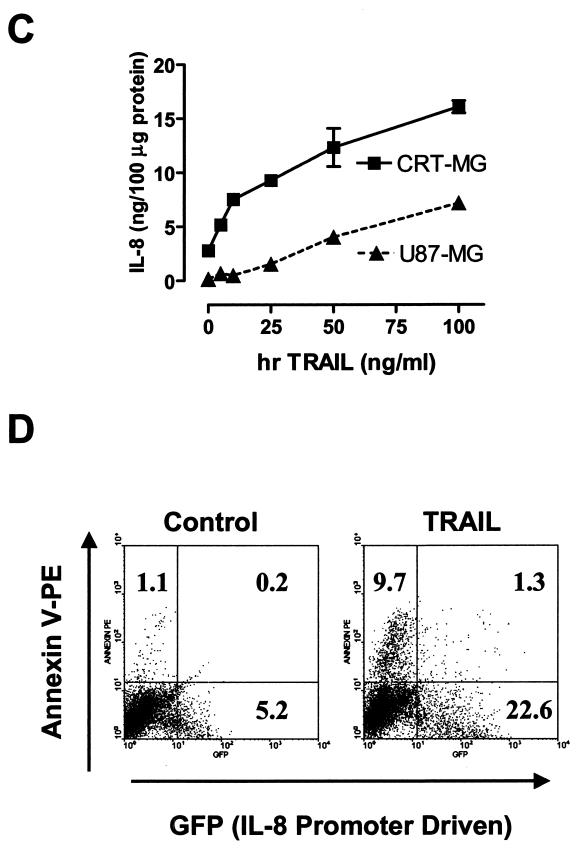
Induction of IL-8 expression upon DR5 ligation. (A) CRT-MG cells were treated with TRA-8 (100 ng/ml) or hrTRAIL (50 ng/ml) for various times (0 to 24 h), and IL-8 mRNA expression was measured by an RPA. Fold induction of IL-8 mRNA expression was normalized to the level of glyceraldehyde-3-phosphate dehydrogenase mRNA expression. The data are representative of three independent experiments. Cont, control. (B) CRT-MG cells were transiently transfected with an IL-8 promoter-luciferase construct and the pCMV-β-galactosidase construct as indicated in Materials and Methods. The cells were incubated with hrTRAIL (0 to 100 ng/ml) for 24 h, harvested, and then examined for luciferase and β-galactosidase activities. The luciferase activity of each sample was normalized to the β-galactosidase activity, and fold induction values were calculated as the ratio of the normalized luciferase activity of each sample to that of the control. RLA, relative luciferase activity. Data are the mean and SD for duplicate samples from one experiment and are representative of three experiments. (C) CRT-MG and U87-MG cells were treated with hrTRAIL (0 to 100 ng/ml) for 36 h, and supernatants were examined for IL-8 protein expression by an ELISA. IL-8 expression was normalized to the amount of total protein. Data are the mean and SD for duplicate samples from one experiment and are representative of three independent experiments. (D) CRT-MG cells stably transfected with construct IL-8p-d2EGFP were treated with hrTRAIL (50 ng/ml) for 36 h, stained with Annexin-V-PE, and then analyzed by FACS. The percentage of cells in each quadrant is indicated. GFP, green fluorescent protein. The data are representative of three independent experiments.


