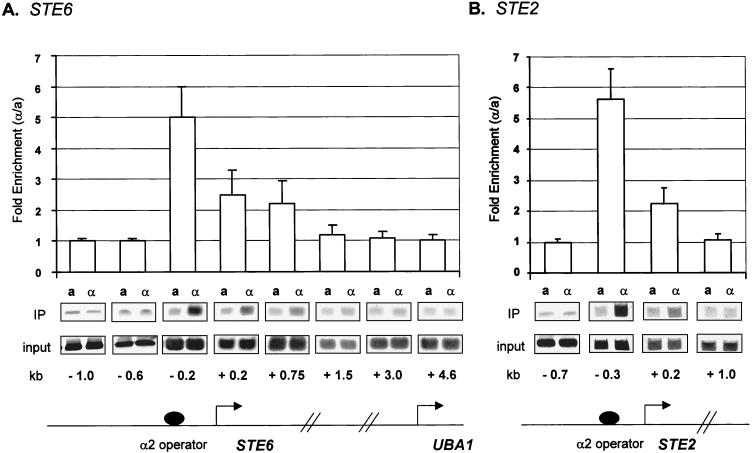
FIG. 1.
Tup1 spreads into the coding region of the a cell-specific genes STE6 and STE2. Chromatin immunoprecipitations (IP) were preformed on cell extracts from a and α HA-TUP1 strains by using an antibody against HA. The location of the PCR primer sets is given in kilobases with the starting ATG as a reference (0.0 kb). These positions are also shown on gene diagrams for STE6 (A) and STE2 (B). All PCR primer sets were designed to generate ∼100-bp products. At STE6 and STE2, the α2 operator spans positions −212 to −182 and positions −228 to −200, respectively. The bar graph represents the ratio between the signals from α cells (repressed) and a cells (derepressed). For the graph, four independent experiments were averaged and the error bars are shown. Quantitative PCR products from one representative experiment are shown.

