FIG. 3.
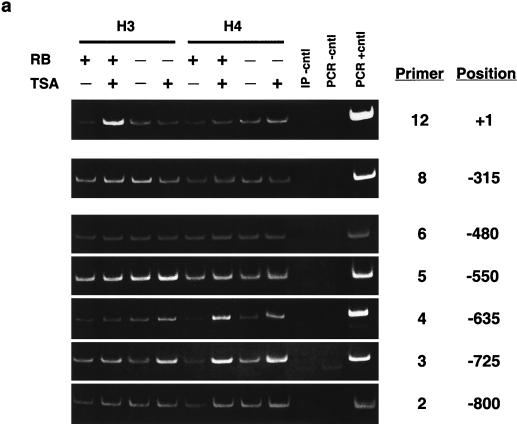
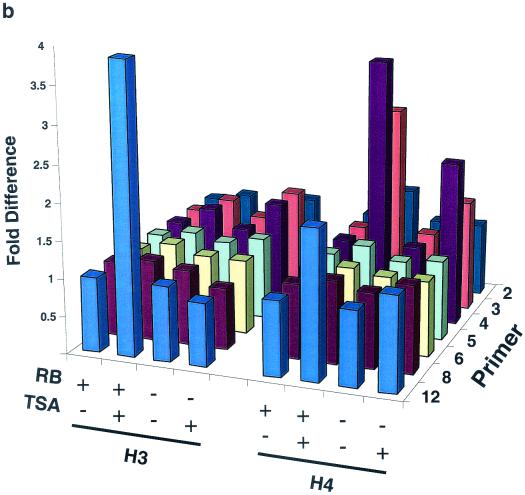
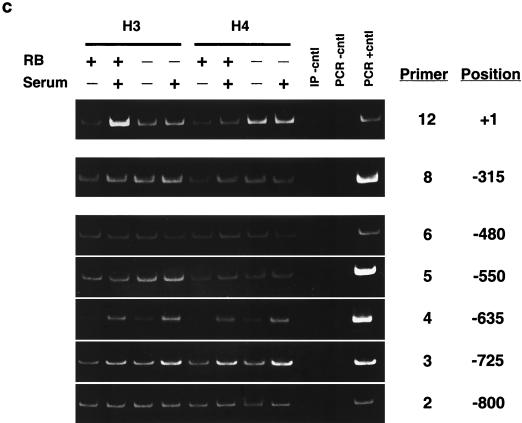
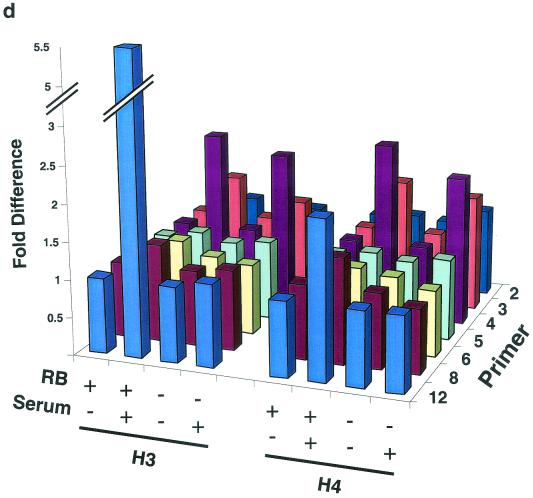
ChIP analysis of histone H3 and histone H4 acetylation on the mouse cyclin E promoter in micrococcal nuclease-digested RB+/+ and RB−/− MEF lysates. (a) Cells were arrested in G0 and treated with either TSA or vehicle alone. The position of the nucleosomal region of the cyclin E promoter is shown, as is the designated primer set number for that region. Cntl, control; IP, immunoprecipitation. (b) Graphic representation of the results shown in panel a. This graph was obtained by performing density scans of PCR results using NIH Image 1.62 software. Data are presented as the fold difference, obtained by setting the value for the untreated (−TSA) samples within each cell line to 1. (c) Cells were arrested in G0 (−serum) or induced to late G1 (+serum). The position of the nucleosomal region of the cyclin E promoter is shown, as is the designated primer set number for that region. (d) Graphic representation of the results shown in panel c.


