FIG. 6.
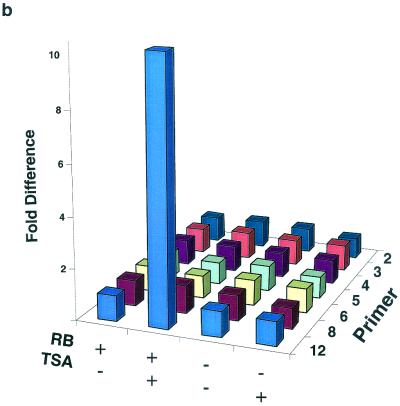
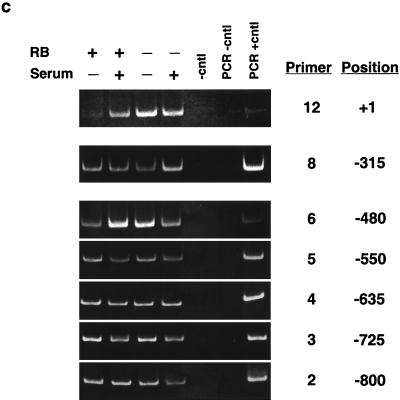
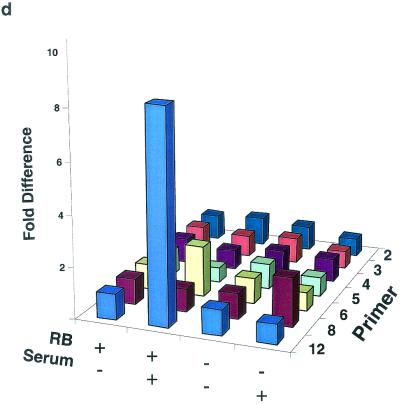
Thiol pulldown analysis of the chromatin structure on the mouse cyclin E promoter in micrococcal nuclease-digested RB+/+ and RB−/− MEF lysates. (a) Cells were arrested in G0 (−serum) and treated with either TSA or vehicle alone. The position of the nucleosomal region of the cyclin E promoter is shown, as is the designated primer set number for that region. Cntl, control. (b) Graphic representation of the results shown in panel a. See the legend to Fig. 3 for details. (c) Cells were arrested in G0 (−serum) or induced to late G1 (+serum). The position of the nucleosomal region of the cyclin E promoter is shown, as is the designated primer set number for that region. (d) Graphic representation of the results shown in panel c.


