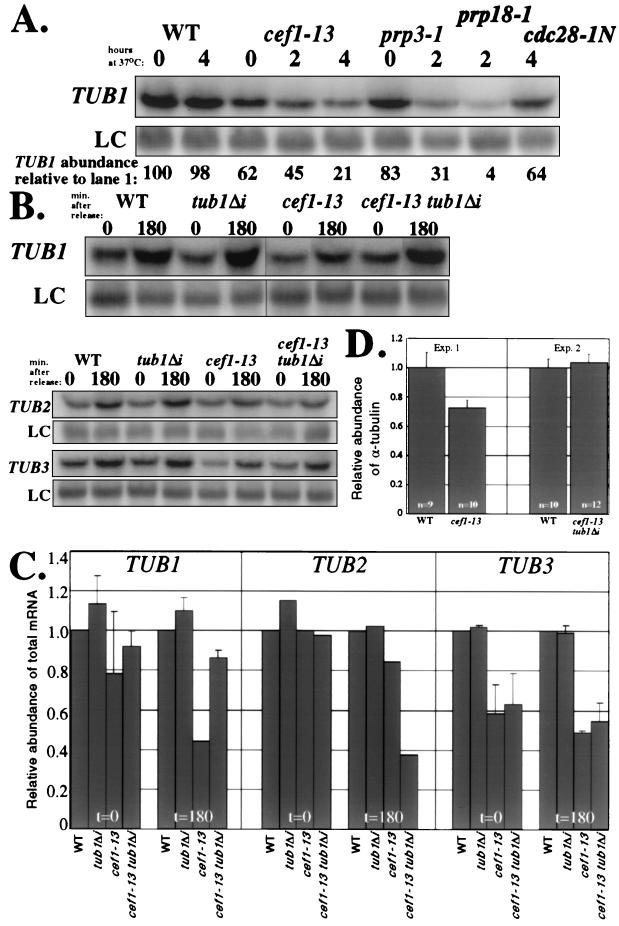
FIG. 3.
cef1-13 cells have less TUB1 mRNA and α-tubulin protein unless the TUB1 intron is deleted. (A) Northern analysis of total TUB1 mRNA abundance in asynchronous cultures shifted to the restrictive temperature. Total RNA was prepared from wild-type (WT), cef1-13, prp3-1, prp18-1, and cdc28-1N cells incubated at the permissive temperature or following shift to the restrictive temperature for the indicated number of hours. The levels of TUB1 mRNA in each sample were quantified by Northern blot analysis using a probe to the entire open reading frame of TUB1. The TUB1 signal in each lane was normalized to that of the non-intron-containing loading control TDH2 (LC) and expressed as a percentage of TUB1 in the first lane. (B) Northern analysis of total TUB1, TUB2, and TUB3 mRNA abundance following synchronization in G1 and release to the restrictive temperature. Total RNA was prepared from WT, tub1Δi, cef1-13, and cef1-13 tub1Δi cells 0 and 180 min following release and blotted with probes for the entire open reading frames for TUB1, TUB2, and TUB3. The non-intron-containing TDH2 transcript was used as an LC. (C) Quantification of Northern analysis shown in panel B. The levels of TUB mRNAs in panel B were normalized to that of the LC TDH2 and expressed as a proportion of lane 1. The relative amounts of each transcript are shown for each strain according to the time point following release from G1. (D) Examination of α-tubulin protein in cef1-13 strains. WT, cef1-13, and cef1-13 tub1Δi cells were synchronized with mating pheromone and released to the restrictive temperature. At 180 min following release, multiple pellets (optical density = 10) were collected. Strains for each experiment were prepared twice. Protein lysates were made from each pellet, and bicinchoninic assays were conducted to allow normalization of protein concentrations between all samples. Equivalent amounts of protein were blotted with an α-tubulin monoclonal antibody (α) and polyclonal antisera raised against TATA-binding protein (encoded by a non-intron-containing gene) as a loading control. The immunoblots were quantitated using a Molecular Dynamics Storm instrument, and the results of α-tubulin protein relative to TATA-binding protein were graphed. The bars indicate the average and standard deviation (error bars). The number of independent analyses for each strain is indicated.

