FIG. 1.
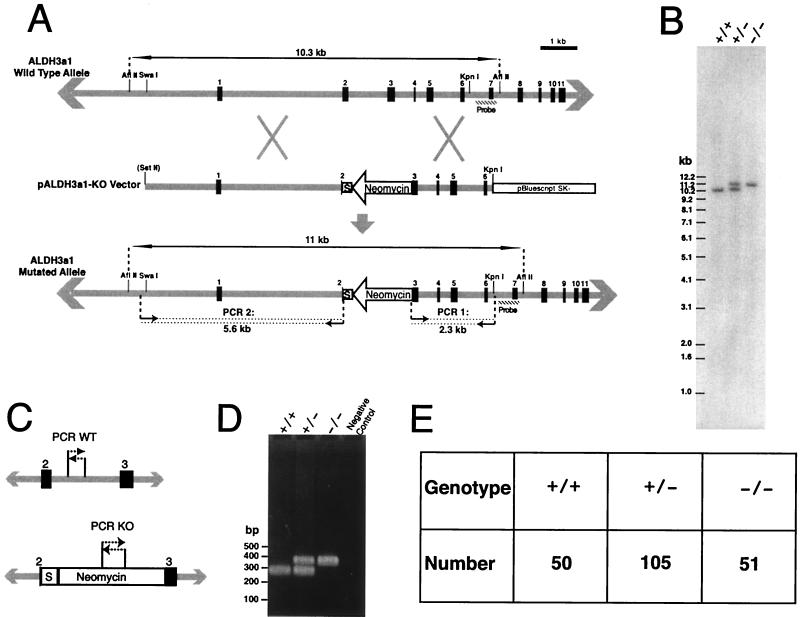
Generation of ALDH3a1-deficient mice. (A) The mouse ALDH3a1 gene locus is represented by gray lines, with exons identified by the number above the black boxes. Restriction maps are shown that were used for cloning, Southern blot analysis, and linearization of the vector at the polylinker. Double-ended arrows delineate the genomic fragments from AflII digests for Southern blot analysis; the hatched boxes indicate regions used as probes. The SstII site is in parentheses to indicate that it was present only in the polylinker of pBS SK(−). The small arrows followed by dotted lines delineate amplified regions in PCR analyses with predicted sizes shown below arrows. The neomycin cassette is labeled, and the arrow indicates the direction of its transcription. The box marked S indicates sequences that contained translation termination codons and a putative transcriptional terminator (see the text). (B) Southern blot analysis of wild-type (+/+), heterozygote (+/−), and homozygote (−/−) animals for the ALDH3a1 allele. For wild-type and homozygote lanes, 1 μg of DNA was loaded, and for the heterzygote lane, 2 μg of DNA was loaded. (C) Regions for PCR analysis of wild-type and knockout ALDH3a1 alleles in progeny from matings between heterozygotes. (D) Results of PCR analyses for wild-type (+/+), heterozygote (+/−), and knockout (−/−) ALDH3a1 alleles in mice. (E) Distribution of ALDH3a1 genotypes for 206 progeny from matings of ALDH3a1 heterozygotes.

