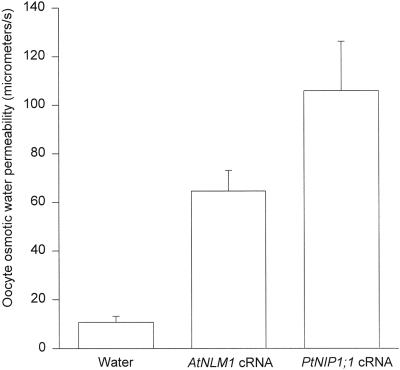
Figure 6.
Average osmotic water permeability, Pos, of oocytes injected with either cRNA (PtNIP1;1 and AtNLM1 [positive control]) or nuclease-free water (negative control). After measuring the rate of change of oocyte volume in response to a 5-fold drop in external osmolarity, oocyte Pos was calculated according to the formula in “Materials and Methods.” Each treatment (injection of PtNIP1;1, AtNLM1, or nuclease-free water) was repeated three times with five to seven oocyte measurements per repeat. For each treatment, height of bars in the figure represents a mean of all oocyte measurements and error bars represent one sd from the mean.

