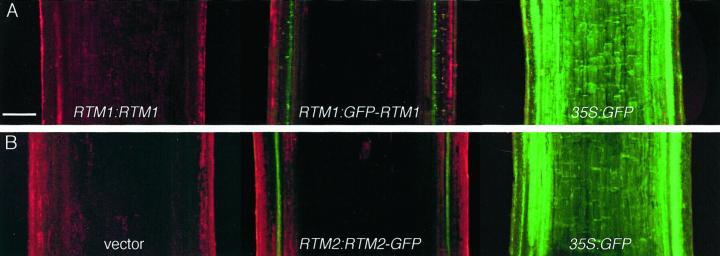
Figure 6.
Detection of GFP in transgenic Arabidopsis plants. A, Longitudinal sections of stem tissue from C24 plants transformed with RTM1:RTM1 (left), RTM1:GFP-RTM1 (center), or 35S:GFP (right). B, Longitudinal sections of stem tissue from rtm2-1 plants transformed with empty vector (left), RTM2:RTM2-GFP (center) or 35S:GFP. Confocal laser scanning images of red fluorescence (from chlorophyll) and green fluorescence (GFP) were merged using Laser Sharp 3.2. Scale bar = 200 μm, all images at equal magnification.

