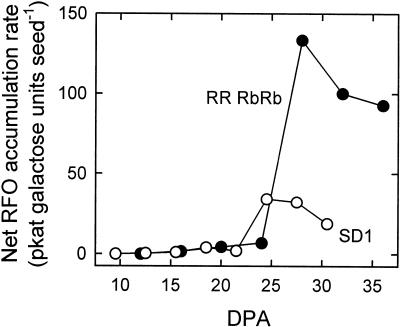
Figure 4.
Estimation of the net rate of RFO accumulation during development of pea seeds of RRRbRb (black symbols) and SD1 (white symbols) lines. Rates represent the increase in total Gal units in galactinol and RFOs (in picomoles) between two consecutive harvests (Fig. 2) divided by the time (in seconds) between the harvests. Data represent the means of three independent replications.

