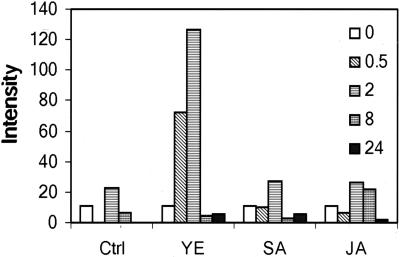
Figure 3.
GmMMP2 expression profiles in suspension-cultured cells following YE, SA, JA, and water control (Ctrl) treatment at the final concentrations of 50 μL mL−1, 50 μm, and 20 μm, respectively. Data, in intensity of the bands from an autoradiogram, normalized on the basis of 28S rRNA intensity, are from a northern-blot analysis of the cells that were treated with the indicated substance for 0, 0.5, 2, 8, and 24 h. The experiment was repeated twice and the average values are presented.

