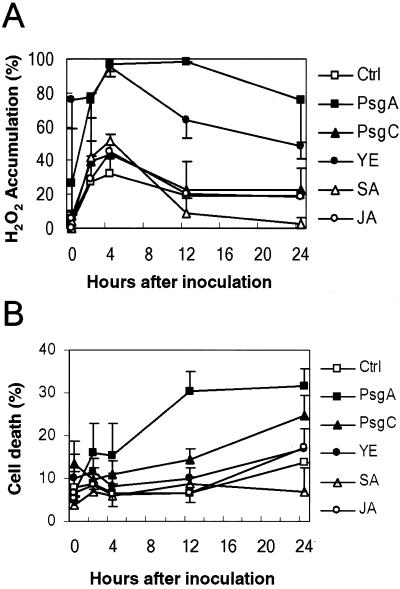
Figure 4.
Oxidative burst and cell death in soybean cell suspensions following infection and elicitation. A, Data were normalized and presented as a percentage of untreated cells. B, For each replicate, three observation fields were counted for an average value. All oxidative burst and cell death data are presented as means with standard deviations of three replicates. Ctrl, H2O control.

