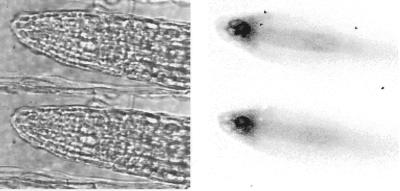
Figure 2.
Expression of PHYA in the root tip. Luminescence images (left) and corresponding bright-field images (right) of the root tip of dark-adapted PHYA:LUC plants. Gray levels of luminescence images are inverted (black represents the strongest signal), showing strongest expression in root cap cells near the meristem and weaker expression in the developing vasculature. Upper and lower panels show adjacent focal planes, which emphasize the lower signals from the older root cap cells.

