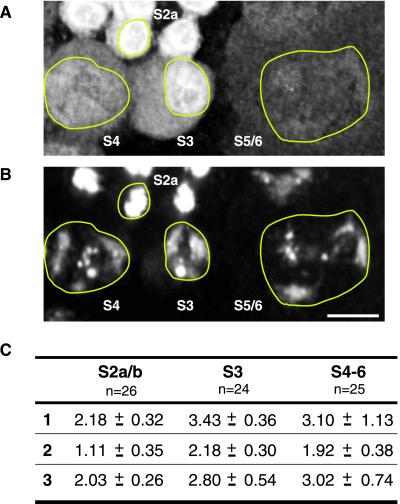
Figure 4.
Quantification of ORD protein in spermatocyte nuclei during G2. (A) Immunofluorescence detection of GFP-ORD and (B) DAPI staining of DNA in P{gfp::ord} spermatocytes. Nuclei are outlined in yellow. Bar, 10 μm. ORD staining appears to diminish during spermatocyte growth. (C) Three-dimensional reconstructions of deconvolved z-series from three different fields of cells were used to calculate the total amount of ORD protein within the nuclei of spermatocytes at different stages of G2 growth. GFP-ORD values were normalized against the average DNA signal for the corresponding stage. The average of the normalized GFP-ORD values is shown for each stage. The number of cells used to calculate the average is indicated below each stage designation. A subset of cells from field 1 is shown above, with specific stages labeled. Units are arbitrary.

