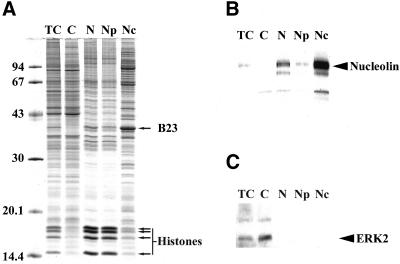
Figure 1.
Analysis of the cellular fractions obtained during nucleoli purification. (A) 1-DE separation of proteins extracted from total cells (TC) and from subcellular fractions indicated on the top of the gel (C, cytoplasm; N, nuclei; Np, nucleoplasm; Nc, nucleoli). For each fraction, 10 μg protein was separated on a 12.5% polyacrylamide gel. Proteins were stained with Coomassie brilliant blue R250. Positions of B23 and histones are indicated by arrows on the right of the panel. Sizes of the molecular weight markers are indicated in kilodaltons on the left of the panel. (B, C) Western blot analyses of the different cellular fractions described in A using an anti-ERK2 antibody (B) and an anti-nucleolin antibody (C). The position of ERK2 and nucleolin is indicated by an arrow on the right of panels B and C, respectively.

