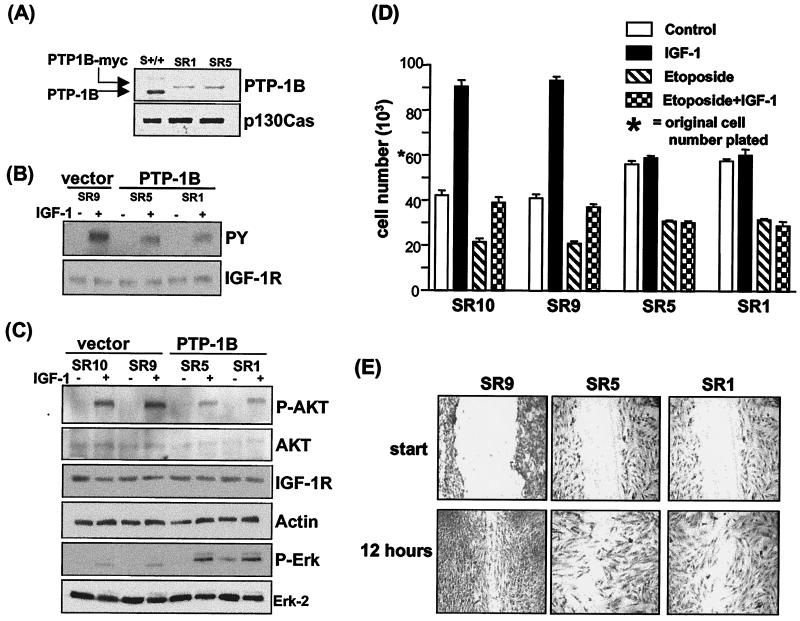
FIG. 8.
Reexpression of PTP-1B in S MEF PTP-1B−/− cells results in decreased IGF-IR and AKT activation. (A) SR1 and SR5 cells were clones isolated after infection of the 1S MEF cells with a retrovirus vector encoding PTP-1B-myc. To compare PTP-1B levels in SR1 and SR5 cells with those in S MEF PTP-1B+/+ cells, the cells were lysed in RIPA buffer and analyzed by Western blotting with an anti-PTP-1B antibody. Arrows, positions of endogenous PTP-1B in the PTP-1B+/+ cells and PTP-1B-myc in the infected clones. The blot was reprobed with the anti-p130 Cas antibody to control for loading. (B) IGF-IR activation in the SR9 control cells as well as SR1 and SR5 cells was assessed by starving the cells and stimulating with IGF-I for 15 min or not stimulating. Cell lysates were prepared, and the IGF-IR was immunoprecipitated, followed by Western blotting with an antiphosphotyrosine antibody (PY). The blot was then stripped and reprobed with an anti-IGF-IR antibody. (C) To assess AKT activation in SR1 and SR5 cells compared with that in two control cell lines that do not express PTP-1B, SR9 and SR10, cells were starved and stimulated with IGF-I for 15 min or not stimulated, lysed, and analyzed by Western blotting for phospho-AKT. The blot was then stripped and reprobed with antibodies against AKT, IGF-IR, and actin. An identical blot was probed with antibodies against phospho-ERK and ERK-2. (D) To measure IGF-I-mediated antiapoptotic activity, cells were seeded at 6 × 10⁴ cells per well in triplicate in 24-well plates and after 12 h the medium was removed and replaced with serum-free medium either alone (control) or containing IGF-I (100 nM), etoposide (5 μM), or both IGF-I and etoposide. The total viable-cell numbers in triplicate wells were determined after 36 h and are represented graphically. (E) To assess cell migration, cells were grown to confluence in medium supplemented with 10% FCS and a wound was then scored in each culture. Migration into the wound was monitored by microscopic visualization, and at 12 h cells were stained with Giemsa and photographed at 10× magnification. For each condition a representative of multiple similar fields is presented. We noted that the PTP-1B-expressing SR1 and SR5 cells have a larger cytoplasm-to-nucleus ratio than the SR9 cells.

