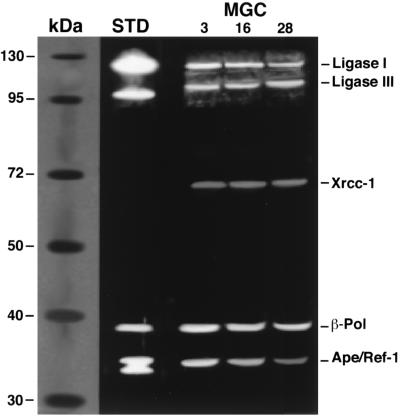
FIG. 5.
Western blot analysis of BER proteins in MGC nuclear extracts prepared from 3-month-old, 16-month-old, and 28-month-old mice. Bands corresponding to DNA ligase I (130 kDa), DNA ligase III (93 kDa), Xrcc-1 (69 kDa), β-pol (39 kDa), and Ape/Ref-1 (37 kDa) proteins were visualized. Triplicate assays were performed for each of three independent nuclear extract preparations. Some variation in signal intensities was observed among Western blots. A summary of all data is shown in Table 2. Molecular mass protein standards and purified DNA ligases I and III, β-pol, and APE/REF-1 (lane STD) are shown for comparison.

