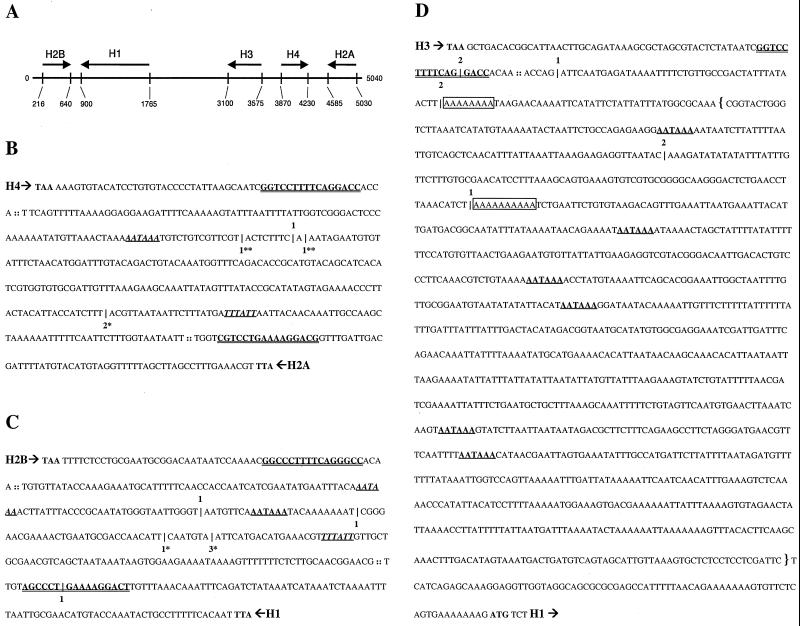
FIG. 5.
RT-PCR mapping of the location of cryptic polyadenylation sites in misprocessed histone messages from dSLBP mutant embryos. (A) Diagram of the 5-kb repeat unit of the Drosophila histone gene cluster. Arrows indicate the direction and length of each histone transcript, which do not contain introns. (B to D) Poly(A)+ mutant histone mRNA was amplified by RT-PCR using an oligo(dT) primer. Cloned products were randomly selected and sequenced to identify the location of polyadenylation. These sites of polyadenylation are indicated by a hatchmark (|) along with the number of times that the particular location was observed. RT-PCR products specific to the histone proceeding (5′ → 3′) top-to-bottom are shown with the number of products above the hatchmark. RT-PCR products specific to the histone proceeding (5′ → 3′) bottom-to-top are shown below the hatchmark. For each gene, the translation termination codon is shown in bold, the processing site is indicated (::), and the stem-loop sequence is depicted in bold and double underlined. Canonical polyadenylation signal sequences downstream of the processing sites are shown in bold with a single underline. Those signal sequences properly spaced with respect to polyadenylation sites determined by RT-PCR products are shown in italics. RT-PCR products corresponding in size to S1 products in Fig. 4 are shown with matching asterisks (∗, ∗∗). (B) H4/H2a intergenic sequence; (C) H2b/H1 intergenic sequence; (D) The downstream sequence of H3. RT-PCR products mapping to putative polyadenylation signal sequences are observed for histones H4, H2a, H2b, and H1. 3′-End mapping of misprocessed histone H3 mRNA was hampered by the presence of oligo(A) (boxed) sequences in the template mRNA. The DNA sequence included in the H3-ds probe used for detection of misprocessed histone H3 mRNA by embryonic in situ hybridization in Fig. 7 and 9 is indicated with brackets.

