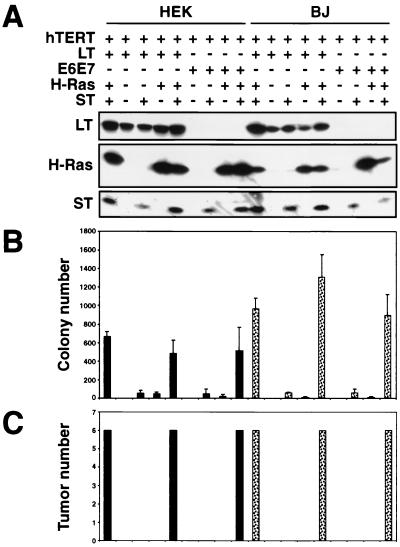
FIG. 2.
Analysis of cell lines expressing combinations of the LT, ST, hTERT, H-Ras, and HPV proteins. (A) HEK or BJ cells expressing the indicated combinations of introduced proteins were analyzed by immunoblotting of 100 μg of total cell protein and separation on 7.5 to 15% gradient gels. All of the cell lines expressed hTERT, as assessed by TRAP assay (data not shown). Cell lines created with the SV40 ER are depicted in the first column of HEK and BJ cells. As shown, although LT is expressed at a higher level than ST, LT and ST introduced from distinct retroviral constructs were expressed at levels similar to those in cells infected with a retrovirus that transduces the entire SV40 ER. The LT exposure time was 1 min, while the ST exposure time was 30 min. (B) AI colony formation. The mean and standard deviation of three experiments are shown. (C) Tumor formation in immunodeficient mice. The numbers of tumors observed after six s.c. injections are depicted. In panels B and C, HEK cells are represented by black bars and BJ fibroblasts are represented by dotted bars.

