FIG. 5.
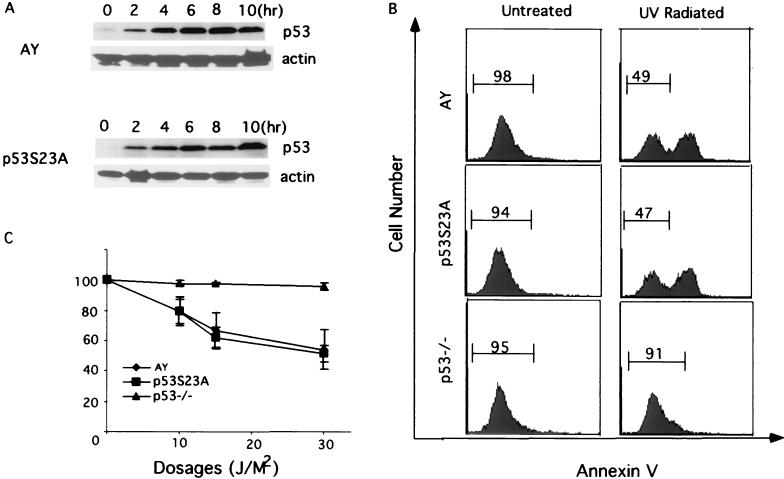
Induction of apoptosis in p53−/−, AY, and p53S23A ES cells after UV treatment. (A) p53 protein levels in AY and p53S23A ES cells at different times after UV treatment. Time after treatment is indicated at the top, genotypes are indicated on the left, and p53 and actin are indicated on the right. (B) Flow cytometric analysis of AY, p53−/−, and p53S23A ES cells harvested 16 h after exposure to 30 J of UV light/m2. Cell number is plotted as a function of the intensity of staining for Annexin V. Cells staining positive for Annexin V are apoptotic. The percentages of nonapoptotic cells are shown. (C) The percentage ratio of nonapoptotic cells in irradiated AY, p53−/−, and p53S23A ES cells relative to nonapoptotic cells in unirradiated controls 16 h after exposure to 10, 20, or 30 J of UV light/m2. Mean values from four independent experiments are presented with error bars. Percentages (y axis) were determined as follows: (no. of nonapoptotic cells in irradiated ES cells/no. of nonapoptotic cells in untreated control) × 100%.

