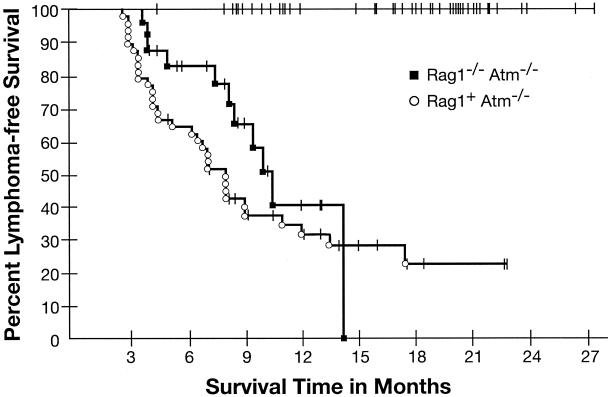
FIG. 1.
Kaplan-Meier analysis of tumor incidence. Thymic lymphoma-free survival is plotted versus time in months for Rag1−/− Atm−/− mice and littermate controls. A drop in the curve represents the sacrifice or death of an animal diagnosed at necropsy with malignant thymic lymphoma. Tick marks represent the sacrifice or death of an animal that was not subsequently diagnosed with malignant thymic lymphoma. As no Rag1−/− Atm+/+ or Rag1+ Atm+/+ animals were diagnosed with malignant thymic lymphomas, the curves for these two groups are at 100% event-free survival.

